Showing posts with label marketing analysis. Show all posts

Monday, December 20, 2010

Can Marketing Really be a Revenue Engine?


It's a key question in today's business environment - can marketing really be a revenue engine, or is this current energy around marketing driving revenue just a fad that will blow over. I was truly honored to host a panel at Dreamforce to discuss that question with three of the very best in the field.

In this panel discussion, Michael Williams of McAfee, Daniel Greenberg of TrialPay, and Chris Boorman of Informatica dug into the question from three very interesting angles and showed exactly what they had done in their respective businesses to rethink marketing as a revenue engine and drive business for the organization.

If you've been thinking about marketing automation as an investment, wondering what the excitement is over the new revenue performance management space, wondering how you can take your own team forward, or looking for some interesting metrics and KPIs on marketing's performance, this video is worth the watch.

If you find this presentation interesting, or want to look more deeply at some of the metrics that were talked about feel free to have a deeper look at how each revenue engine was build by looking at it on SlideShare.
BOOK
Many of the topics on this blog are discussed in more detail in my book Digital Body Language
SOFTWARE
In my day job, I am with Eloqua, the marketing automation software used by the worlds best marketers
EVENTS
Come talk with me or one of my colleagues at a live event, or join in on a webinar

Monday, December 13, 2010

Four Interesting Trends from Dreamforce


Last week I had the pleasure of wandering the floor at Dreamforce, Salesforce.com’s annual conference. As the SaaS conference of the year, it’s a great time to get a pulse on how everyone is thinking about the next few years. This year, I spent a lot of time talking with the exhibiting ISVs, both large and small, and as I did so, I found a few key themes that resonated.

At Eloqua, we’ve been talking about Revenue Performance Management for a while now, and it was good to see that many of the themes that are driving that are common across other ISVs in the ecosystem. Here are four themes I noticed as I chatted with vendors on the show floor:

1) Data is Increasingly Critical: One clear trend was the increasing importance of data to those focused on driving revenue. Both as a source of new conversations, and as a source of continually updated insight into a buyer’s fit, data is one of the most important RPM stories of the next few years. Salesforce.com has clearly made a significant investment in this area with their acquisition of (and deep integration of) Jigsaw as a data cloud, but folks like Hoovers, D&B, and StrikeIron were very present on the show floor with data sourcing, append, and cleansing services.

2) Communication Contributes to Buyer Insight: There were many vendors who provided communication tools, ranging from PDF trackers to videoconferencing tools and Webinar providers. This was not new, but in each conversation with these providers, including Vitrium, ReadyTalk, iLinc, and more, their focus was on how the use of that communication tool by a buyer can provide rich insight into a buyers intentions. By leveraging attendance data as a key part of a buyer’s digital body language, marketers and sales people are much better armed.

3) Integration Must Be Seamless: Salesforce.com has long focused on the need to seamlessly tie together all interactions with customers, and this viewpoint is spreading throughout the entire buying process. Integration providers like Cast Iron, Informatica, and Pervasive had packed booths as visitors looked to understand how to seamlessly tie together every pre-purchase interaction, whether in social media, search, webinars or in any other communication vehicle.

4) 2011 will be the Year of Analytics: It is now beginning to be possible to see the entire buying process from end to end. With that possibility, revenue analytics jumps to the forefront as an extremely hot area. Both on the floor and in the track sessions, executives were asking about the right metrics, measurements, and KPIs to measure in order to ensure that their revenue engines were running in the most efficient manner possible

I have never been more excited about the RPM space, and seeing the breadth of solutions on display at Dreamforce tells me that others quite definitely share this excitement. 2011 will be an exciting year indeed.

BOOK
Many of the topics on this blog are discussed in more detail in my book Digital Body Language
SOFTWARE
In my day job, I am with Eloqua, the marketing automation software used by the worlds best marketers
EVENTS
Come talk with me or one of my colleagues at a live event, or join in on a webinar

Tuesday, November 16, 2010

The Changing Dimensions of Lead Flow


One of the more interesting ways of assessing the revenue performance of an organization that we looked at in thinking about revenue benchmarking was via an overall plan (whether just an adjustment of historicals, or a forward-looking revenue projection). However, in building an end-to-end plan for managing your overall revenue performance, it is important to stay aware of how the “dimensions” change over time. As a marketer or salesperson interacting with a prospective buying audience, how that audience is defined changes as a more direct connection is made with them. While this change is unimportant if each stage is dealt with separately, it becomes important to understand and model correctly as the entire process begins to be viewed with the same lens.

- At the earliest stages of interaction with buyers, as they are just entering into the awareness and education stage, the metrics that are trackable are around interactions and views. Whether it is views of a banner ad, anonymous visitors on a website, or searches being performed against key phrases, these views are often anonymous and may occur multiple times for the same individual.

- As individual prospects become known, uniquely identifying them by an identifier such as an email address or other id becomes possible. At this point, multiple interactions with one person can be tied together and that individuals actions can begin to qualify them as potentially being a marketing qualified lead.

- As a marketing qualified lead is handed to the sales team, and an opportunity is created to explore the interest that is expressed, the opportunity is generally with the purchasing company, with multiple interested individuals associated to it.

- The opportunity itself, as it is explored in further detail, will begin to have an approximation of size associated with it. Depending on what is being sold, this is associated with an annual contract value, total deal size, or other measurement of bookings.

- When a deal is closed, and services begin to be rendered, this bookings number will translate to a flow of revenue, based on the appropriate accounting standards being used.

At each point in an overall plan that a change in the "dimension" of what we're measuring will take place, this transition must be taken into account. If a conversion rate between website traffic and inquiries, or between leads and sales opportunities, is being benchmarked against as part of the plan, it must take this change in dimension into account. In most cases, this shift in dimensions can be built in as part of any conversion rate that is used in an applicable situation. For example, if 15 opportunities are created out of 1000 leads, a 1.5% conversion rate can be quoted (although I'm sure that the more rigorous mathematicians amongst us will cringe), and planned against without problem.

However, it’s important to realize that this change in dimensions did take place, and if any change in buying pattern or marketing approach takes place, a change in the number of individuals involved in a deal could shift this number without any underlying change in the likelihood of an opportunity to be created.

In your planning, are you clear on what the "dimension" is that you're measuring at each stage? An individual? A company? A dollar?
BOOK
Many of the topics on this blog are discussed in more detail in my book Digital Body Language
SOFTWARE
In my day job, I am with Eloqua, the marketing automation software used by the worlds best marketers
EVENTS
Come talk with me or one of my colleagues at a live event, or join in on a webinar

Tuesday, August 31, 2010

Measuring the Unmeasurable: Influencers


One of the most important ways to "get the word out" and have your message discovered is to have good relationships with key market influencers. However, while this is important, it can be notoriously difficult to measure.

We need a new way of measuring how engaged we are with each influencer in the market. Whereas historically, there may have been only a few influencers (the major analysts and media outlets), and maintaining relationships with them was the purview of the PR and AR groups, now there are a broader set of influencers and maintaining those relationships is the purview of everyone on the team. Measuring this effort, however, can prove challenging. The following framework is a starting point for assessing your ability to influence the market influencers.

1) Value of a Publication

The first step is to assess the publishers and publications you would like to influence. I use the term “publication” and “publisher” very loosely to refer to any writers, bloggers, thought leaders, and content contributors online. These are the individuals and outlets where influence is useful and interesting. Each publication that is of interest should be assessed (subjectively) and given a rating of one to three stars. This is based on their readership, reputation, presence, and whether they appear in the search results for key terms your buying audience is looking for.


2) Relationship Activity

With this step complete, and knowing which publications you are hoping to influence, you next need to track how active you are in maintaining those relationships. As most, if not all, of these individuals are online writers, this activity can be tracked very objectively. Each blog comment, each Twitter conversation, each LinkedIn discussion that someone on your team has with an influencer is a relationship activity. Each is an opportunity to build awareness, convey messages, introduce new perspectives, or develop a deeper level of trust. Tracking this activity, across your entire team including subject matter experts, gives you a clear metric on whether those relationships are being actively maintained.


3) Relationship Strength

For each relationship, it’s important to also assess whether you feel that the relationship is a strong one. This is a subjective measurement, and can only be done by the people involved in each relationship. Use a similar scale of one to three stars to show your assessment of the strength of each relationship.


4) Mentions

Now, with these relationships understood and assessed, you can look at whether this effort is bearing fruit in terms of mentions of your company, your solutions, and your views on the market. This metric is only useful when viewed as a trend over time, as different publications with different niche focuses will naturally mention company and product names in a wide range of frequencies. An upwards trend in mentions is generally a good thing and shows a positive influence.


5) Sentiment

However, mentions are usually only good if they are neutral or positive mentions – that highlight your strengths, key aspects of your reputation, and your views on the market. Although there is some good progress happening in the realm of technology solutions for sentiment analysis, this is often quicker and easier to do in a B2B environment using a subjective assessment.


With each of these dimensions analyzed, you can begin to gather a picture of how your overall team is influencing the key influencers in your market. Over time, these relationships will develop and grow, and can become an extremely effective way that your message reaches your intended audience.

It's not perfect, by a long stretch, but this framework at least provides a way to look at the challenge of measuring influencers and efforts to work with them. How are you approaching this challenge? Any different measurement frameworks you use?
BOOK
Many of the topics on this blog are discussed in more detail in my book Digital Body Language
SOFTWARE
In my day job, I am with Eloqua, the marketing automation software used by the worlds best marketers
EVENTS
Come talk with me or one of my colleagues at a live event, or join in on a webinar

Tuesday, August 10, 2010

The Sales Team as a Content Testing Crucible


It's been a while since we've talked much about the topic of sales enablement, so I wanted to loop back to some interesting peripheral points. Marketing teams generally work hard to provide not just content and messaging that is available online, but also content and messaging that can be used directly by sales teams as they guide buyers through the buying process.

This usage pattern is very powerful, in that it allows the sales team to use their intuition, insights, and judgments in deciding what content to provide to what buyer at what moment in time. This human judgment can often provide more insight than digital body language alone, and if looked at carefully can provide the marketing team with a good understanding of what content is most valuable.

This direct use of content by the sales team provides a valuable content testing crucible for understanding both which messages are being used and which are effective in guiding buyers. For example, in the following chart, you can see that the Product Spec Sheet is not being discovered by the sales team, while the ROI calculator is being discovered by sales, but is not being used. The Video Testimonials content is being used frequently, but is not connecting with the buying audience, while the Technical Specifications, while used less, are well received by the audience they are sent to.


This ability to assess content from a sales usage standpoint, as well as from a market reception standpoint enables marketing efforts to be directed at only the most highly leveraged investments.
BOOK
Many of the topics on this blog are discussed in more detail in my book Digital Body Language
SOFTWARE
In my day job, I am with Eloqua, the marketing automation software used by the worlds best marketers
EVENTS
Come talk with me or one of my colleagues at a live event, or join in on a webinar

Tuesday, July 20, 2010

Evaluating Marketing Automation - 10 Questions To Ask


The market for marketing automation software is doing very well these days. This has lead to an unprecedented variety of options for marketers to choose from, and the range of options can be dizzying. While many of the discussions can focus on software and feature/function comparisons, this is only one element of success. To be truly successful, you need focus on the people, process, and technology changes with equal energy. As a big believer in the economics of smart buyers, I wanted to share ten question areas that are key to dive into when evaluating a marketing automation investment.

The people and process elements of the investment are often the most interesting. Some organizations have the skills in house to make the needed business process changes, and some organizations are more comfortable bringing in outside expertise in order to facilitate discussions, avoid mistakes, and gain consensus on the changes.

If you have not gone through this process before, you will want to ask your team, your consulting partner, or your chosen software vendor some deep questions in order to ensure that you will be able to succeed with your software implementation.

There are no "right" answers to look for, but these are areas to discuss, debate, and understand. These questions will differ based on your business and your team, but the following list of ten questions will hopefully get you started.


Ten questions to ask your team, your services partner, or your software vendor, in order to highlight key questions, process issues, and areas of concern:

1) How will we define a qualified lead for sales?

Having sales buy in to your definition is crucial, but reaching agreement between marketing and sales on the definition of a qualified lead is not as easy as it seems. What mistakes can be avoided? How will you score explicit (who) and implicit (how interested) activity? Are there multiple product lines that need to be scored separately?


2) What is marketing's service level agreement with the sales team?

How are leads routed to sales? Are there overlays for strategic accounts, specific product lines, or geographies we need to take into account when routing leads? How will these be handled? How is routing in “large” geographies like New York city or California handled – zip code? Area code? How quickly do leads need to get to sales? What happens when leads are passed to sales – does sales have a specific time frame for follow-up? What if this is missed, are leads clawed back?


3) What do we do with leads that are not yet ready for sales?

Can we establish a lead nurture program? Do we have the right content? How will we monitor whether the audience is losing interest? How will we make sure we are not over/under-communicating to each person? Do we have the content in place to guide buying criteria over time as we nurture?

4) How will our marketing automation data and CRM data integrate seamlessly?

What if a person doesn’t exist in the CRM system? What if they exist multiple times? If a person is influenced by multiple campaigns, how does this appear? How is digital body language presented to our sales team? How do the data, activities, and process aspects of the integration work together with our business?

5) How good is our data? How good does it need to be?

Are our titles/geographies/industries/revenues all standardized and normalized? Is new data from lists, web forms, CRM systems, and tradeshows standardized? Are we building rules for personalization, segmentation, lead scoring, or lead routing on top of data that is not standardized? Are there best practices for building a contact washing machine that we want to leverage?

6) Do we need to add data from external sources?

Are we going to ask prospects for every piece of information we need? Can we leverage sources like Dunn & Bradstreet to append data and avoid asking excess questions? Where in the process will we do this? What do we do about internally sourced info like sales territories or geographic regions – how can we append this data if we need to? Do we have an understanding of how to balance the customer experience between asking for too much, and too little data?

7) Do we understand how to maximize email deliverability?

How will we ensure that our emails are delivered? Do we have the right people to understand what technologies need to be in place to maximize email deliverabililty? Do we have the right relationships with ISPs and policy boards? Will emails appear to come from us, or from a third party? Can we allow our audience to manage their own preferences? What are the best approaches to use? What metrics will we look at to understand and report on email deliverability to see if we’re starting to encounter problems?

8) What analysis and dashboards will we present to management?

What are our key metrics? What industry benchmarks will we compare to? How will we define the stages of the buying process? How will we measure each of those stages? If there are many touchpoints in an overall buying process, how do we measure the effectiveness of an individual campaign? What will our executive marketing dashboards look like?


9) Where are we going? What is our strategy and roadmap for success?

Is there a marketing maturity framework we are using in order to guide our progress year over year? Do we know where we are currently on that framework? Do we have a plan for how we are going to make progress each quarter/year? Is management bought in to the goals?

10) How well do we understand the needs of our international colleagues?

Do we understand the cultural difference in marketing to each geography that we need to be aware of? Do we understand the regulatory differences in terms of permission and data management? How are we going to deploy a single platform to our international team? Do we understand the best approaches?


A few of these questions may not be relevant to your business, but many of them will, and they will take the discussion beyond feature comparisons in software platforms and into the realm of what it will take to truly drive success in your business. By taking a deep dive into each of these areas, you will gain a better understanding of your own needs, and the capabilities of various providers in meeting those needs. By doing so, you will move yourself one step closer to success.
BOOK
Many of the topics on this blog are discussed in more detail in my book Digital Body Language
SOFTWARE
In my day job, I am with Eloqua, the marketing automation software used by the worlds best marketers
EVENTS
Come talk with me or one of my colleagues at a live event, or join in on a webinar

Tuesday, July 6, 2010

4 Quick Steps to Understand Search Discoverability


We are not all natural search experts, nor should we be. There is a lot of art and science to the field that makes it worthy of having a specialist on your marketing team focus on consistently. However, that does not mean understanding how well you are performing is outside of the reach of non-experts.

Here are 4 quick steps to understand how well you are performing. Only step 4 requires any tools or techniques that are not immediately available.

Step 1: What Will Buyers Look For?
Define a list of around 10-15 terms that, when buyers are searching for them, you would ideally be discovered. This requires putting yourself in the mindset of a buyer and avoiding any “internal speak” or terms that are not the most common terms. As an example, buyers generally search for “laptops”, even if you happen to call them “netbooks” internally.

One Step Further: To take this a step further, think about how buyers might “broaden” the term slightly and expand each of your 10 terms. For example, while “marketing automation” is a key phrase for us, buyers may be looking for a “marketing automation platform” or “marketing automation software”.


Step 2: Where Are You Ranked?
For each of the terms in your list of 10-15, do a quick search on Google and/or Bing. Find the first piece of content from your web properties, and record the rank. Search rankings change over time and by location, but this will give you a sense of whether you are discoverable.

One Step Further: While you are doing this exercise, it can be interesting to jot down the search ranks of your main competitors so you can compare your performance to theirs over time.


Step 3: Who’s Looking?
Go to Google Trends and look up each phrase in order to understand rough volumes of searches. You will likely find that buyers tend to look for some phrases more often than others. This gives you a relative volume, but will help you understand what is important.
One Step Further: Narrow your analysis by country. You may find that the phrases used differ significantly by country.

Step 4: When Are You Found?
Look at the people who land on your site from a search, and categorize them by the search phrase used. For each of your 10 main phrases, how many people are finding your content each month. At a raw traffic level alone, this can provide a lot of insight into the success of your efforts to get content ranked on the search engines.

One Step Further: Traffic is great, but understanding who these visitors are and whether they progress towards being marketing qualified leads and ultimately revenue is even more of interest. For each search term, see how many leads, opportunities, and dollars of revenue are ultimately created.


Performing well in the natural/organic search results requires a good understanding of search optimization techniques, and a robust discipline of content creation. However, understanding the basics of natural search performance is both accessible to all without any technical knowledge or tools, and important to understand in analyzing whether your buying funnel has any challenges with discoverability.
BOOK
Many of the topics on this blog are discussed in more detail in my book Digital Body Language
SOFTWARE
In my day job, I am with Eloqua, the marketing automation software used by the worlds best marketers
EVENTS
Come talk with me or one of my colleagues at a live event, or join in on a webinar

Wednesday, May 12, 2010

Behavioral Targeting and Large Populations


I'm a big proponent of marketing measurement and careful analysis, but it's worth a cautionary tale as sometimes measurements can lead one astray. The more finely tuned your messages are to the interests of the buyers, the more they can cause analysis confusion if not approached correctly.

The core of great B2B marketing communications is relevance. If your message is relevant to the audience you are communicating with, it will resonate, if not, no matter how well written it is, it will not resonate. However, the key to relevance is understanding the interests of each prospect so that a marketing message can be delivered accordingly.

Within your universe of prospects, there may be only a small percentage of them at any one time who are the precise buyer role and executive level, at the particular stage of the buying process that your marketing message ideally targets. However, many marketers fall into the temptation to broaden out their messaging to a larger universe in order to get an overall increased effect. Whereas this may seem like a good idea, as it increases the overall campaign results, it can have the unintended effect of alienating a large segment of your audience as we discussed recently in looking at the idea of neutral results in a marketing campaign.

Equally importantly, however, is the fact that a poorly targeted message can lead to highly inaccurate marketing measurements due to the overall effect of a larger population. For example, let’s look at two marketing messages, for comparison. Message one was highly relevant to VPs of Marketing at the Solution Discovery phase of their buying process (2% of your database), and achieved a stellar 30% response rate in that segment. Message two was relevant to Managers of IT at the Awareness and Education phase (10% of your database), but only achieved a 8% response rate in that segment.

For the sake of this example, let’s assume that the general population of your database, outside of the segment to which each message was relevant, responded equally poorly with a 1% response rate.

If this campaign was targeted to the entire database, you can see quickly how the results can show a counter-intuitive message. Message one, would show a 30% response rate in 2% of your database, and a 1% response rate in 98% of your database, for an overall response rate of just 1.58%.

Message two would show an 8% response rate in 10% of your database and a 1% response rate in 90% of your database for an overall response rate of 1.7%. If you look simply at the raw numbers, without diving deeper into the analysis, you can see how the final results will be misleading and will show the reverse of what is true. Clearly, it is the definition of the list, rather than the message success itself, that is causing these results to appear as they do.

Only by first looking at the targeting of your list, including both the fit of the individual, and the stage they are in their buying process, can you successfully show analytics that correctly reflect how effective each message was within that target psychographic or demographic segment. The results might be surprising.
BOOK
Many of the topics on this blog are discussed in more detail in my book Digital Body Language
SOFTWARE
In my day job, I am with Eloqua, the marketing automation software used by the worlds best marketers
EVENTS
Come talk with me or one of my colleagues at a live event, or join in on a webinar

Wednesday, March 17, 2010

Calculating the Value of a B2B Marketing Campaign


It’s the ultimate question in marketing:

What effect did this campaign have on revenue?

In short buying cycles, where the buyer generally understands the category of the offering, and the transaction is quick and simple, this can be measured relatively easily. A marketing campaign results in a website visit, a product is added to the visitor’s shopping basket, and the transaction is completed. Tying the buying event to that marketing campaign is both easy and sensible. Various marketing campaigns can be analyzed to see what offer, and what creative, drive more revenue.

But in the longer buying cycles we see in B2B, this analysis is not so simple.

Buyers progress through a buying process at their own pace, facilitated by marketing messages and campaigns, but not necessarily driven by them. Some campaigns may generate broad awareness, some might educate on criteria to consider, and some might trigger buying actions directly. All are valuable, but measuring their value requires a different approach than in simple buying processes.

Understanding the Stages

The first key step is to understand where each person is in their buying process. Some may be just names in your database, either acquired names or names that have gone inactive. Some may be interested, but not ready for sales yet, and some might be ready to engage with sales. Lead scoring allows you to objectively define where each person is in their buying process.

As part of this process, it’s important to make sure that buyers are removed from stages if time passes and they don’t continue to show the buying behaviour indicated. As buying behaviour can be transient, with interest starting and stopping at various points, it’s key not to leave an individual marked as being at a certain stage if they are no longer as interested as they once were.

Associate Value with each Stage

With the buying stages defined, it’s now possible to look at historical conversion rates to understand the value of a lead at each stage. For example, if a deal is worth $10,000, and an MQL has a 10% conversion rate to a deal, it is worth $1,000. Similarly, if a lead at the “mild interest” stage has a 1% chance of converting, it is worth $100, and if a raw name that has not yet shown any interest has a 0.2% chance of turning into revenue, it is worth $20 per name.

It’s important to note that these values are based on the conversion rate of the stage through to close, rather than the conversion rate to the subsequent stage.

Campaigns, Transitions, and Value

Now, with this value per stage established, it is finally possible to see the value of a buyer’s movement through the funnel even if it does not directly translate to closed business or qualified leads being passed to sales. For example, if a buyer moves from “mildly interested” ($100/lead) to “marketing qualified lead” ($1000/lead), their value has increased by $900. Similarly, if a buyer moves from “inactive name” ($20/lead) to “mildly interested” ($100/lead), their value has increased by $80. If net new leads enter the funnel, and are deemed to be “mildly interested”, they are immediately worth $100.

If a marketing campaign triggered that transition to take place, the simplest way to look at the value of the marketing campaign is that it added that much value to your lead funnel. If a campaign costs $50,000 and causes 1000 leads to move from “inactive name” to “mildly interested” (1000x$80), pushes 10 leads from “mildly interested” to “marketing qualified lead” status (10X$900), and creates 200 new “mildly interested” leads that were not previously in the marketing database (200X$100), the value of the marketing campaign can be calculated as:

Cost of Campaign: $50,00

Value of Campaign:
1000 X $80 = $80,000
10 X $900 = $9,000
200 X $100 = $20,000
=================
Total: $109,000

You can see that, if only the creation of qualified leads is looked at, the value of the campaign would appear to be very low, whereas it was a very successful and valuable campaign in that it triggered a lot of valuable early funnel re-engagement of inactive names, and generated new interest.


Campaign Value

Many campaigns that we run as marketers are targeted at top-of-funnel, or mid-funnel outcomes. Generating net new names, educating buyers, establishing evaluation criteria, and nurturing buyers are all very valuable activities to perform. However, they can be extremely difficult to measure unless there is a framework in place to assign value to each of the early stages in the buying process.

When the right marketing analysis framework is in place, and each stage of the buying process can be measured, valued, and analyzed, it becomes possible to associate a clear value to campaigns that are targeted at top-of-funnel activities. When we build the overall marketing dashboards for our organizations, we can then value these campaigns in the same way that we value campaigns that target moving mildly interested leads further down the funnel until they are ready for a conversation with sales.
BOOK
Many of the topics on this blog are discussed in more detail in my book Digital Body Language
SOFTWARE
In my day job, I am with Eloqua, the marketing automation software used by the worlds best marketers
EVENTS
Come talk with me or one of my colleagues at a live event, or join in on a webinar

Tuesday, March 2, 2010

Social media analysis moves mainstream


Last week, Webtrends announced that they had extended their customer intelligence capabilities into Facebook. In this new integration, there are two things happening that are worth commenting on. First, there is a continuing move to see a unified view of online behaviour, and online messages across all communication channels, and not a siloed view where each individual communication platform is treated as somehow separate.

In exploring the Webtrends solution, you can see this evolution taking place. When a blog post is written, Tweeted about, then shared on Facebook this is a natural way that information flows in today’s environment. An analytics platform that treats each of the platforms as silos would be forcing marketers to think of communications by “silo” not by “idea”, and that would be a significant mistake. The barriers between social platforms, and between those platforms and our blogs and web properties are rapidly disappearing and already virtually non-existent.

This manifests in both the way that the data is captured (not just within properties under our direct control like main websites, but wherever the audience is, such as on Facebook) and in how it is presented, as an integrated view of activity across communication platforms.

The second interesting trend that became apparent in looking at this integration of Facebook activity into the marketing analysis world was the lack of campaign centricity. Facebook, as with almost all social media efforts, has a “flywheel” dynamic to it. Effort is put in continually, and over time, the success begins to build slowly, but with its own momentum. This is drastically different than typical marketing campaign efforts where each campaign has a fairly defined investment/payback model; a point-in-time investment which is tied to a short-term payback.


Webtrends shows metrics on community success (views, shares, fans, etc), and indicates through “flags” where the driving events (such as blog posts, tweets, and marketing promotions) took place. By doing this, they guide marketers to the view that the driving events are there to build community, engagement, and influencers, which will then over time drive the creation of qualified leads. This view is significantly different than the more direct campaign-to-lead model of typical marketing, but a much more accurate representation of the marketing realities of social media.

As we market to B2B buyers, optimizing how information finds its way to them is crucial. To do this well means that we need to think more in terms of the ideas, and less in terms of the channel by which the information is disseminated. Similarly, as we build our engagement with our buying audiences in social media, we need to think more in terms of how our efforts are building and driving community success, rather than thinking in terms of single campaigns. With their new ability to analyze Facebook, understand the flow of ideas across social media channels, and see community success mapped against the events that drove it, Webtrends helps us make important steps in this direction.

What do you think? Have you tried their new capability in your environment? What insights are you able to gain from it that you weren’t able to get previously?
BOOK
Many of the topics on this blog are discussed in more detail in my book Digital Body Language
SOFTWARE
In my day job, I am with Eloqua, the marketing automation software used by the worlds best marketers
EVENTS
Come talk with me or one of my colleagues at a live event, or join in on a webinar

Thursday, February 18, 2010

Cash Flow Statement as a Metaphor: Sources and Uses of Leads


Earlier, we introduced the financial metaphors for balance sheet and income statement when looking at B2B marketing analysis. Following on the same financial metaphor, a “cash flow” statement can show valuable insights into the sources and uses of leads, allowing you to dashboard the lead flow within your organization in order to understand which territories, product lines, or business segments are seeing more lead flow than others, and whether the leads are being successfully converted into opportunities.

Understanding which sales teams are seeing the best sourcing of leads gives a good sense of whether there is any imbalance in the lead flows. For example, in the following data, you can see that although the West is generally getting more leads, they are of significantly lower quality. Similarly, while there are lots of leads for Widget B being generated, there is a significant imbalance in lead flow to reps in the East.


With this understanding of which territories, product lines, and salespeople are provided with leads, the next step is to provide insight into the outcome of those leads once they have been handed off to sales. Done properly, the disposition of leads by a sales team after they attempt to connect with them should not only trigger a marketing process to correctly handle the leads, but also provide clear insights into the quality of the leads. If the leads were unreachable, lacked interest, were not the right role, or only had early stage interest, this insight allows marketing to see whether there are potential quality issues with their leads.

Likewise, if certain sales reps are doing a poor job in following up with the leads they are given, this will also show up in the analytics of lead disposition. In the following lead disposition chart, for example, you can see that both Bob Clark and Jane Chen received a large number of leads, but failed to convert many of them to opportunities, instead resorting to voicemails or calling back in 90 days. This may be an indication of a performance or training challenge with these two sales reps.


The more visibility we introduce to our processes for building interest, qualifying leads, handing them to sales, and having sales connect in order to grow a revenue opportunity, the better we are able to improve those processes. The cash flow statement, as a metaphor, provides a great way to look at which sales teams are getting good sources of leads, and what the uses of those leads are. The ability to optimize this lead flow or guide the sales team's response lets us optimize revenue quickly and effectively.
BOOK
Many of the topics on this blog are discussed in more detail in my book Digital Body Language
SOFTWARE
In my day job, I am with Eloqua, the marketing automation software used by the worlds best marketers
EVENTS
Come talk with me or one of my colleagues at a live event, or join in on a webinar

Monday, February 8, 2010

Calculating the True Cost of an Email Campaign


Since the advent of email marketing in the mid-1990s, companies have embraced the misconception that email is virtually “free” as a marketing medium. This false impression often leads to over-communication, which, in turn, triggers diminished response rates, spam complaints, and unsubscribes. Even marketers who are sensitive to email recklessness sometimes face internal pressures, such as of year revenue numbers, to send “one last blast to the entire database” with the justification that “it doesn’t cost us anything.”

So what is the true cost of an email campaign?

To understand true cost, you need to first understand your marketing database a little better. The names within it are not all equally engaged, and your actions affect this level of engagement.

Net New Names

At one end of the spectrum are the names entering your database. As a marketing team, you work hard to populate your database -- attending shows and events, putting on webinars, publishing research, and investing in paid and natural search. As these efforts succeed, new names will enter your marketing database. By understanding the investment it takes to create these marketing programs, and then dividing that total cost by the number of net new names in your database, you can calculate a Cost per Net New Name. For the sake of this discussion, let’s assume that cost is $10.

Emotional Unsubscribes

At the other end of the spectrum are the people who are disengaging from your messaging. The reality is that many marketers only measure actual unsubscribes – those who clicked on the unsubscribe link – as their measure of disengagement. However, this limited measure fails to fully account for the way in which most email recipients disengage. Most recipients reflexively ignore or delete unwanted messages, rather than clicking on an unsubscribe link. At this point, they have “emotionally unsubscribed,” and are not paying attention to your messages.

To identify people who have “emotionally unsubscribed,” you need to measure whether they have engaged at all – email opens, clicks, or website visits – in the past three or four months. If not, it is likely that they have disconnected from your communications.

The Path to Disengagement

Between these two ends of the spectrum is what you, as a marketer, control. Irrelevant messaging, poorly targeted content, and thinly disguised sales pitches will quickly drive your audience away. To understand how it takes for your prospects to disengage, you must analyze your email marketing history. Look at the number of “ignored” emails between any two “non-ignored” emails. If you look at a “reasonable maximum” for this number – say the 80th percentile – you can see how long it takes a person to disengage. For example, if only 20% of your audience ever re-engages after they have ignored 20 emails in a row, your Disengagement Path is 20 emails. Let’s use this figure for our example.

Calculating a Real Cost

Now, with these two values, you have a way to calculate the true cost of an email campaign. People who disengage must be replaced with net new names, or your overall effective marketing database shrinks. So, for an email campaign that is sent to 100,000 people, of which 40,000 open it, we have 60,000 who did not engage in any way.

The cost of this campaign is found by dividing those 60,000 by the Disengagement Path of 20. This email campaign can be said to have pushed the disengagement of 3,000 people.

At $10 per name, this loss of 3,000 people has a true cost of $30,000. Not an insignificant cost for an email marketing campaign at all.


If thought about in this way, which is much more accurate than just the hard costs of the email send itself, we would all make significantly better email marketing decisions as we would be guided by a much more accurate view of the economics.


(This article was originally published as a guest post on MediaPost)
BOOK
Many of the topics on this blog are discussed in more detail in my book Digital Body Language
SOFTWARE
In my day job, I am with Eloqua, the marketing automation software used by the worlds best marketers
EVENTS
Come talk with me or one of my colleagues at a live event, or join in on a webinar

Wednesday, January 20, 2010

CEOs and Marketing Metrics


CEOs may not be involved in the day to day challenges of the marketing department, but they can strongly influence its evolution through the questions that they ask and the metrics that they track, both in the marketing and sales teams. Done well, this structure and encouragement can facilitate a transition to a buyer-centered, efficient marketing and sales organization. Done poorly, however, the structure and metrics that a CEO imposes on his or her team can prevent the needed transitions from taking place.

High Level Framework

At the executive team and board levels, CEOs should measure marketing on objective, standard metrics around marketing’s ability to create, nurture, and qualify sales-ready buyers. By looking at Marketing’s ability to manage the top end of the revenue funnel through balance sheet and income statement metrics, CEOs will instill the discipline of defining the stages of the buying process, measuring leads against these stages, and facilitating buyers’ movement through each stage by carefully targeted campaigning.

Similarly, CEOs must work to have Sales and Marketing present their views of revenue projections, and the needed investments, in a coordinated fashion. The hand-off of a lead from Marketing to Sales should be based upon a mutually agreed-upon definition, and thus should enable a common view of the entire funnel from the earliest stages of awareness to the final closure of a deal. With this in place, and with an understanding of the conversion times and percentages between each two stages, there is an ability to see potential revenue shortfalls well in advance and adjust investment across the entire Sales and Marketing spectrum accordingly.

Conflicting Metrics

Without this coordinated focus, it is easy for conflicting metrics to develop. For example, if a Marketing team is focusing on only handing highly qualified leads to Sales, they will naturally reduce the number of leads that are passed. If, however, the Sales team is managed and measured based on activity metrics such as the number of calls per day, they will resist the reduction in lead volume from Marketing, even though the lead quality is significantly higher.

In measuring Marketing, CEOs encourage the right behavior when they think in terms of the buyers’ buying process:

- How is awareness of your solution category first developed?

- How do buyers educate themselves, and is that education process something you should be a part of?

- When prospective buyers understand a business challenge or opportunity and seek to solve it, do they discover your company?

- How are solutions selected and validated in your category?
What criteria are used, and how have we educated buyer on why to select us?

These questions focus marketing on understanding and facilitating buyers throughout the entire buying process.

What this may mean, however, is that Marketing focuses more on processes that continuously nurture prospective buyers, continually allow your solutions to be found, and gradually establish buying criteria that allow your solution to be selected. This can often reduce the number of large, one-off campaigns that attract significant internal attention, but may do far less to engage with buyers, as they are timed and targeted based on the company’s needs and schedules rather than those of the buyers.

Results in Terms of Buyers

CEOs that ask Marketing for results that are defined in terms of the prospective buyers – such as the movement of prospects between one stage of their buying process and the next – allow Marketing to better focus on campaigns that facilitate buyers. While large one-off campaigns can at times be useful, they often attract a disproportionate amount of internal attention due to their higher internal visibility. CEOs that avoid the temptation to only ask for and look at large one-off campaigns are guiding Marketing teams in a direction that is more focused on the needs of buyers.

Driving a Marketing team to look at hard metrics for their campaigns, and to take responsibility for those metrics has some interesting repercussions. A marketing team can commit to revenue metrics, delivery of objectively qualified leads, and to managing an overall healthy and predictable revenue pipeline. With this responsibility and measurement, however, comes the associated ability to associate compensation with directly measurable performance. CEOs should not be afraid to challenge long-held beliefs on compensation levels between Sale and Marketing. Even institutions such as Presidents’ Club, long the purview of Sales, should be opened up to anyone in the Marketing organization performing sufficiently well against objectively defined metrics.

CEOs that set the right framework and structure for their Marketing and Sales teams can drive an evolution of performance. However, simple actions and metrics, or long-held beliefs that are not challenged, can easily derail the best intentions of Marketing and Sales executives seeking to improve their own performance.
BOOK
Many of the topics on this blog are discussed in more detail in my book Digital Body Language
SOFTWARE
In my day job, I am with Eloqua, the marketing automation software used by the worlds best marketers
EVENTS
Come talk with me or one of my colleagues at a live event, or join in on a webinar

Thursday, January 14, 2010

The Foundation for Great Marketing is Great Data


Data is key to all your marketing efforts. Whether it is segmentation, personalization, lead scoring, lead routing, or marketing analysis, if you don’t have clean and consistent data, your efforts will be built on the shakiest of foundations. However, when thinking about your marketing automation efforts, data management can often be an afterthought.

However, some minimal upfront efforts to understand and improve the quality of your data can greatly improve your effectiveness as a marketer.

Current Database

First, you need to understand your current database. There may be a significant amount of data in your database, but unless it is data you can work with, it will not be adding value to your organization. Some simple analysis should give you a good sense of your current state:

- Growth and Total Size: The simplest of metrics; analyzing both the total size of your database and its growth over time gives you a clear sense of what you’re starting with. Net new contacts add to your total, while bouncebacks, and unsubscribes detract from it. In this measurement, be sure that you are truly measuring unique contacts, without any duplication. The overall database size should be growing in a healthy manner, although growth rates can vary depending on the growth rate of your company and your industry.


- Active/Inactive: Of equal importance to size of your marketing database is the analysis of what percentage of your database is active or inactive. A basic definition around “active”, such as a certain number of emails opened or clicked, visits to the website, or form submits will give you an objective definition of who is active. Those who are inactive may have “emotionally unsubscribed”, and are unlikely to be future buyers. It is more important that the active component of your database is growing over time than the overall size.


- Completeness: Each field that is of importance to you should be analyzed for its completeness. In many marketing databases, key fields may be only 30% or less complete, which leads to challenges in using those fields for marketing efforts. If your analysis shows that fields are less complete than ideal, you may want to use progressive profiling to add data to those fields


- Consistency: Even if a field is filled, if the data is inconsistent, it can be very difficult to derive value from it. Fields like Title, Industry, Country, State, or Revenue are very often extremely inconsistent as the data can be input in a wide variety of ways. Analyze each field for the breakdown of what values are in that field and their percentages to see if the data is generally consistent or inconsistent.


Some marketing automation platforms are able to perform this kind of analysis, but there is a lot of variation in the industry, so ask the tough questions if you are considering a marketing automation investment as this analysis will be key to your success.

Data Sources

With your own marketing database quality understood, you then need to begin understanding your sources of data to understand what will make your data challenges worsen if not controlled. Marketing data comes from many different sources, each of which has its unique opportunities and challenges.

- Other Systems: Marketing often sources data from CRM systems, data warehouses, or customer data masters. The data from these systems often must be brought in on a nightly (or more frequent) basis, and integrated into your marketing data. In many cases, there is limited opportunity to change the format or quality of the original data, and it must be dealt with on import automatically each time it is imported


- Continual Sources: Web forms, tradeshow leads, webinar registrants, and trial downloaders contribute a steady flow of data to the marketing database. The continual nature of these sources means that as a marketer, your database is being updated 24 hours a day, 7 days a week. This means that data cleansing must be done continually, and inline, rather than as a batch process once or twice a year


- Controlled vs Non-Controlled: Many of the sources you deal with are not sources that you are able to control. Lists from tradeshows, business cards, and many web forms are not sources that you are able to control, so the data from them is of varying quality and varying standardization

Given that you, as a marketer, are dealing with a variety of data sources, many of which are out of your control, and many of which are operating 24x7, keeping the data clean and consistent can be a significant challenge. The best way to approach this is to build a “contact washing machine” that standardizes and normalizes your data. Each time data is touched, whether from a web form, a list upload, or from your CRM system, it should flow to the contact washing machine.

Again, this is an area to ask tough questions in if you are looking at making an investment in lead management software as it makes a significant difference to your success. Look for contact washing machines that are a single, centralized point of data cleansing, and can handle standardizing and deduping data fields from industry to title to revenue. The best option is to have a pre-built structure out of the box, that you can then modify to meet the exact requirements of your business.


Data and the User Experience

In thinking about data, there can be a temptation to burden your audience of prospects with the data requirements of your marketing database. This is never a good idea. Many studies have shown that the more fields you add to your web forms, the more likely you are to see users drop off and not fill them out. Similarly, the more you restrict the input options that you provide to your audience (such as only allowing drop-down select lists for an individual’s job title), the more frustrated your audience will become.

The best option is to approach the challenge in two ways. Progressive profiling can be used to ask for a minimal amount of data at each interaction, never ask the same question twice, but continually add to a modular profile. This allows you to minimize the number of fields being asked per web form, and maximize the conversion rate. For the data itself, given the user frustration added by constraining their options, and the fact that many sources of data are beyond your control anyway, it is often better to allow free-form data while managing its quality via a contact washing machine once it enters your marketing database.


Data as a Foundation for Great Marketing

Today’s best marketers are building their creative campaigns, precise segmentation, accurate lead scoring, and relevant personalization on a base of great data quality. In fact, when top CMOs talked about their marketing dashboards, the focus on quality data was key to each of their successes. Whether you have made a marketing automation investment, and are looking to maximize the return you get from it, or are considering a marketing automation investment and want to know the right questions to ask, data should be front and center. It’s the foundation upon which everything else in marketing rests.

(*this post was originally posted on the Focus.com marketing community)
BOOK
Many of the topics on this blog are discussed in more detail in my book Digital Body Language
SOFTWARE
In my day job, I am with Eloqua, the marketing automation software used by the worlds best marketers
EVENTS
Come talk with me or one of my colleagues at a live event, or join in on a webinar

Thursday, December 17, 2009

Simple Metrics and the Business Case for Marketing Automation


There has been a lot of great discussion lately about the business case for marketing automation. For obvious reasons, I'm excited to see the discussion, but it often takes an interesting turn. The way in which people often attempt to measure it is in either efficiency gains, or revenue gains - when compared with a manual process for marketing in the same way.

This is the comparison I see a challenge with, and viewed in that light, it will be hard to see the level of value that is being seen today by the best marketers.

If you look at what marketing automation does in terms of business transformation, it is insufficient to characterize it in terms of simply just an efficiency gain, or a revenue gain. It changes the way that we, as B2B marketing organizations, are able to interact with prospects, and opens up new avenues of prospect understanding and prospect communication that simply would not have been viable without marketing automation.

A comparison is the transition from film to digital cameras. If you look at what is possible with film cameras, in terms of photo sharing, digital editing, virtually unlimited photo storage, and the social media use of photos, it is clear that digital cameras present an entirely new way of interacting with images. If contemplated from a framework of film photography, you might look at something like sharing a photo to Facebook and think of digital cameras as offering an efficiency gain; it’s possible with film, you just snap the photo, develop it, scan it, save it to a file, and then upload it. Much less “efficient” but still possible.

However, this misses the point. These things are not simply spectrums of efficiency or revenue, as there is a certain point at which the task would simply not be done.

If you look at the business process that B2B marketers using marketing automation are working to enable, it has a similar challenge. A simple way of looking at it is that we are seeking to:

a) Understand prospective buyers through reading their digital body language

b) Communicate with them accordingly, either through lead nurturing when they are early in their buying process, or through sales engagement if they are later in their buying process

The challenge with making a direct comparison between marketing as enabled and automated with today’s marketing automation software platforms, and marketing without using automation is that the level of buyer understanding and engagement being sought is simply not attainable without automation in any practical way.

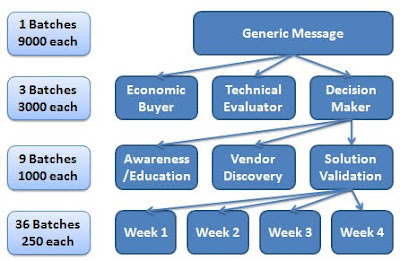
To put the marketing situation in context, using marketing automation, we are attempting to deliver the right message to the right buyer at the right time. This means that we might use digital body language to understand the buyer’s role in the buying process (technical evaluator vs economic buyer), we might seek to understand where they are in their buying cycle (awareness/education vs vendor discovery vs solution validation), and we might attempt to time a message a week after they last engaged with us in order to remain top of mind.

Building this with outbound, batch and blast marketing solutions leads to a fundamental problem. Even with this simple version of buyer understanding and message personalization, the level of personalization required quickly moves you from a single communication per month, of perhaps 9000 recipients, to 36 individual communications, each only going to 250 people. On top of this, the lack of built-in awareness of buyers’ digital body language would mean that you had 36 individual segments to select, based on an off-line analysis of the prospect’s behavior.

This leaves us in a similar comparison to the digital vs film photography example. Much as sharing photos on Facebook is theoretically possible using film photography, but in practical terms virtually impossible, marketing in a way that understands and responds to buyers’ digital body language is, in any practical terms, impossible without marketing automation software. You must compare one overall approach with another, and understand it in aggregate.

So, when compared in aggregate, it is tempting to come back to the argument that it only makes sense in terms of a revenue gain or a cost decrease. This is not altogether false, but must be understood in context of your overall market. As it is not possible to truly understand and respond to the unique buying process of each of your buyers without a marketing automation solution, the comparison must now be understood in the context of the competitive landscape. If your competition is understanding and engaging the prospective buyers in your industry based on their individual buying processes, while you are not, they will have access to revenue that you simply will not have access to.

Framing the argument in terms of marketing automation allowing an increase in the efficiency, or the output of an existing revenue generating process is ignoring the fact that marketing automation allows a fundamental, and much needed, change to the revenue generation process itself.
BOOK
Many of the topics on this blog are discussed in more detail in my book Digital Body Language
SOFTWARE
In my day job, I am with Eloqua, the marketing automation software used by the worlds best marketers
EVENTS
Come talk with me or one of my colleagues at a live event, or join in on a webinar

Tuesday, November 24, 2009

Marketing Automation and B2B Marketing Predictions for 2010


It’s coming around to that time of year again when we all offer up predictions for what the coming year will offer. As with any of these, it’s a guess, and entirely my own opinion. Here are some of the trends and changes I think we’ll see in the coming year. If, at the end of the year, it turns out I guessed right on a few of these, I will be happy.

Overall Prediction Trend:

Buyers continue to gain control of their own buying processes, and marketers respond by building "revenue engines" to understand, facilitate, measure, and predict these buying processes.


1) Data is Free, Relationships are Not: As contact data becomes more and more available, approaching free in many cases, the value of the relationship will increase. As part of a continuing trend, the ability of your audience to block, prevent, and ignore communications that they don’t desire will increase, with reduces the value of the data (who they are), and increases the value of the relationship (their perception of you). Marketers who think this way, and truly work to provide valuable information to their audience, will do well.


2) Relationships, Education, and Nurturing: The trend in data becoming free (prediction 1) will work in parallel with a trend in information, of relevance to buyers, being expected to be free. Buying relationships will be more and more built on a foundation of buyer education, and the B2B organizations who can educate and nurture prospective buyers over time, without annoying them will win. This means an investment not just in the rich educational content, but also in systems to automatically understand buyer interest and deliver (or have discovered) educational content appropriate to the buyer’s next step.


3) A Degree in Marketing Engineering?: As marketing shifts towards a discipline whereby prospective buyers are understood based on their behavior, and the right content, according to where they are in their buying cycles, is delivered, marketing skills become more operational, process, and data oriented. Marketing hiring will swing towards backgrounds that have these data, operations, and process skills more so than copy and creative skills. Marketing education likely won’t change in this regard during 2010, but the initial discussions will start.


4) Mobile Thinking vs Mobile Devices: Every year in living memory has been talked about as the year that mobile will become big. I think that this coming year will finally see that claim begin to disappear. Sort of. Now that various devices such as the iPhone, are truly able to support a rich, interactive, graphical environment, interacting with your audience in places where they are mobile becomes very possible, but the device, and mobile-specific technology, almost becomes irrelevant. Thinking about what will motivate an audience to act, when they are at a show, see a poster, or are at a venue, how they can connect (text message, or short URL), and what the interaction should be will become part of many B2B marketers’ thinking. Specific mobile technologies, however, will not move beyond niche applications.


5) Brand Promise/Reality Gap Reduction: The trend that social media kicked into high gear in 2009 will continue into 2010; any organization that has a significant gap between their brand promise, and their brand reality will have that gap mercilessly exposed through social media and community-created content. 2010 will see aggressive adoption of basic listening techniques by marketers in order to understand where they are falling short. The gaps here will lead to a much broader discussion of what “brand” means to a B2B organization, that goes beyond logos, taglines, and colors.


6) Marketing Owns The Brand: 2010 may see some very early reshuffling of the decks in terms of what Marketing owns. Social media (prediction 5) will broaden the discussion of “brand” from logos and taglines to the full offering including service and product. A few very early examples will arise of organizations in B2B who have changed their definition of the Marketing team to truly provide them with greatly enhanced ownership or influence into the product/solution areas of the business as well as the services areas around it, as those are both critical to overall company brand and reputation. We likely won’t see mainstream shifts in this ownership until 2011 or beyond.


7) Follow me, Friend me, or List me: in 2010 we’ll see a dramatic shift in the definitions of influence in social media as we move from raw counts (like Followers or Friends) which are almost entirely ignorable, and to a model that comes one step closer to true influence. Each social media site will implement things differently, but an “inner circle” model of people who one actually pays attention to, versus just being a connection, will rapidly grow in relevance. Social media sites that do this well will balance the need for public awareness of how influential a person is (how many inner circles, they are part of) without making it so public that it is widely manipulated or gamed (like Twitter follower counts, for example).


8) Information Discovery Measurements: As marketers begin to cede control of the messages they push out, and begin to act more like publishers without assuming control of the distribution, they will begin to look for measurements of information discovery as their key driver. How, where, and from whom, did an individual discover information relevant to key stages in her buying process. Rather than measure individual outbound campaigns, measuring the likelihood of individual messages to be discovered, ideally through sharing and forwarding, will become more key to marketers.


9) Social Activity, Lead Scoring, and Lead Nurturing: As buyers begin to get more and more of the messages, information, and education through their peers, and through social media, these channels will quickly grow in their relevance to lead scoring and lead nurturing approaches. Awareness of how an individual discovered a message, where, and from whom (prediction 8) will feature very prominently in the lead scoring and lead nurturing routines of leading marketers.


10) Digital Body Language vs. the Discovery Call: As buyers gather most, if not all, of their early information (prediction 2) on the vendors they are considering speaking with online, the role of the salesperson’s “discovery call” shrinks and changes. In 2010, in sales organizations, we will see a rapid recognition of the new reality that buyers are less willing to take an initial call from a vendor salesperson with an assumption of only exchanging basic information. If sales people want to engage with buyers they will need to read buyers’ digital body language, and ensure that they are able to add more value than Google on the initial sales call. If sales teams do not have access to this information they will begin to push their marketing teams to provide it.


11) Measuring the Revenue Engine: As the above trends evolve in 2010, marketers will begin to develop their ability to predict revenue trends well in advance of sales, by measuring and analyzing the overall revenue funnel. Marketing leaders who can do this will become among the most strategic executives at the board room table.


What do you think? Are these predictions likely to happen? I look forward to your thoughts on these.
BOOK
Many of the topics on this blog are discussed in more detail in my book Digital Body Language
SOFTWARE
In my day job, I am with Eloqua, the marketing automation software used by the worlds best marketers
EVENTS
Come talk with me or one of my colleagues at a live event, or join in on a webinar

Tuesday, November 17, 2009

Marketing Analysis: Foundations for Great Analysis


One of the most commonly cited benefits of implementing a marketing automation system is the opportunity to improve your organization’s ability to analyze marketing effectiveness. This is indeed possible, and provides a powerful advantage to organizations who are successful. However the final outcome of great marketing dashboards rests on a strong foundation of data. Ensuring that the data you need is available, cleansed, and normalized is critical to generating the analysis you need.

In evaluating a marketing automation software investment, it’s crucial to look at this overall stack and ensure that you will be able to access the right sources of data, keep that data clean, and then build an analysis framework on top of that. In this post, we’ll look at the key foundational elements of good analysis.

Data Sources:

The first part of this foundation is having the data that you need. Without the right data, analysis is impossible, so this forms the first key area to evaluate, even before looking at any reports or analytics. The following examples give you a sense of the types of data you might need available within your marketing automation system in order to perform certain types of analysis:

Product Purchase History: an analysis of whether individuals who bought product A are more responsive to messages about product B, or product C, would require you to integrate and store information about product purchase history within your marketing automation system

Social Media Effectiveness: understanding the effect of your social media efforts on buyer behavior requires you to track all key social media interactions with both known and unknown web visitors, and associate them back to purchase activity

Offline Activity: analyzing the effectiveness of offline activities, such as tradeshows or lunch seminars will require you to capture and track that information (registrants and attendees) within your marketing automation system

Each of these data sources is continually changing, so in thinking about your marketing automation choice, you’ll need to ensure you have the needed integration capabilities in order to get any data that resides in external systems into your marketing automation platform.

Data Quality:

The next foundation for marketing analysis is data quality. By this, we mean the ability to manage duplicates, cleanse, and normalize data. As marketing data is continuously touched – by web forms, list uploads, event registrations, and white paper downloads – it is imperative to have a process in place to manage this data quality inline.

Some key aspects of data quality that can affect your ability to effectively analyze your marketing efforts are:

Duplication: identical or similar records of individual contacts or accounts need to be identified, matched, and merged. Without this, any measurements of lead count, campaign response, or segment size will be inaccurate or misleading.

Completeness: in many cases, the data in a marketing database is not complete. Records may be missing values, or the data in them is not up to date and accurate. If analysis relies on these field values, it will not be effective until that data is available. The ability of your marketing automation system to do progressive profiling, and gradually add needed data to contact records is crucial in ensuring that you have the needed data completeness in order to properly analyze your marketing effectiveness.

Normalization: Data within a field, such as title, role, industry, or geography must be normalized to standard values in order to effectively analyze it. For example, if analyzing the effectiveness of a campaign in driving response from senior executives, if job titles are not normalized, and “Vice President” is written as “VP”, “V.P.”, “VP of”, “Vice Pres” or “Vice President”, your resulting analysis will be almost impossible.


Great marketing analysis rests on a foundation of great data. The ability of the marketing automation software you select to obtain the needed data, and maintain it in a state of continuously improving data quality is key to your success, and should be a key part of your analysis in making your selection.
BOOK
Many of the topics on this blog are discussed in more detail in my book Digital Body Language
SOFTWARE
In my day job, I am with Eloqua, the marketing automation software used by the worlds best marketers
EVENTS
Come talk with me or one of my colleagues at a live event, or join in on a webinar

Thursday, October 29, 2009

Top-of-Funnel Analysis - Net New Names, Inactive Leads, and Reactivated Interest


Analyzing marketing actions at the top of the funnel has some interesting nuances. This is a direct result of the fact that having a contact’s name within your marketing database does not in any way imply interest. You may have a name in your database that is from many years ago and has not shown interest in recent years, there may be names that were input as part of a list purchase, and have never shown interest. In looking at the top of the funnel, it is critical to be able to carve out these “inactive names” from the rest. Without that, the measurement of campaigns targeted at the top of the funnel, and also your overall funnel conversion metrics will be challenged.

The best way to account for this, is to have a rigorous process of eliminating inactive names from an “Interested” stage at the top of the funnel. If a lead, interested at one point, has made no inquiries, and taken no actions in a period of time, say 3 months, then that lead is placed back in the inactive lead pool.

Campaigns targeted at the top of the funnel then, can have three main effects:

- Generate Net New Names via Inquiries; a campaign that generates buzz in the market may generate net new names for your database that come in as active inquiries. For example, if a whitepaper is offered as the call to action for a campaign, and an individual who was not originally in the database downloads it, they are both a net new name and are now part of the “Interested” stage of the funnel

- Reactivate Inactive Names; a campaign may target Inactive Names in your marketing database, and by doing so cause some of them to re-engage. This is a very valuable transition as those are names that were otherwise not showing any interest in your organization.

- Acquire Inactive Names; A campaign that involves a list purchase or other name acquiring techniques may add names to your database, however these are not people who are showing any interest, and therefore must be deemed to be part of the Inactive Name pool until a campaign succeeds in interesting them

In measuring the effectiveness of your marketing campaigns at the top of the funnel, it’s crucial to separate these transitions. If not, highly successful campaigns that re-engage large portions of your existing, but inactive, marketing database will appear to be minimally successful due to not creating many net new names. Similarly, campaigns that involve an element of list purchase may appear more successful than they truly were as they create many net new names, even though only a small percentage of these individuals will engage with your communications.
BOOK
Many of the topics on this blog are discussed in more detail in my book Digital Body Language
SOFTWARE
In my day job, I am with Eloqua, the marketing automation software used by the worlds best marketers
EVENTS
Come talk with me or one of my colleagues at a live event, or join in on a webinar

Monday, October 12, 2009

Natural Search in B2B Marketing - Analyzing Discoverability


Being discoverable by your potential buyers is critical to success in many businesses. As buyers control their buying process more and more, the need to be found when a prospective buyer is searching for a solution to a business pain is increasingly critical. One of the most obvious elements to this is natural search engine optimization. If a prospective buyer is searching for terms related to your business or the pains you solve, you want them to discover your organization.

If they are early in the buying process, you may want them to discover your thought leadership writings, and recognize you as a leader in the field. If they are at a vendor discovery phase or moving towards solution validation, you may want to have them discover writings that clarify how to think about important aspects of the buying decision.

Measuring this discoverability, however, is an interesting challenge, as there are many search phrases that might be relevant to discovering your solution. Against each of these phrases, your main web site, your social media properties, and your competitor’s web properties may be discoverable.

The first challenge is listing the search phrases that are relevant to finding your solution. For each phase of the buying funnel, you will have a different set of phrases, and this will differ based on the marketing challenge you face. If, for example, your main challenge is a Flying Car challenge, you may wish to focus mainly on the awareness stage, and think about search phrases that are related to, but not identical to, your solution. If prospective buyers are unaware that your solution category exists, they may be looking for solution categories that are peripheral to yours. You will want to be discoverable when they are looking.

At each stage of the buying funnel, list out the key phrases that buyers may be looking for. At the vendor discovery phase, the prospective buyers may be searching for more exact solution category names. At the solution validation phase, the searches may involve your product name directly, but be searching for specific capabilities or objections.

With the search phrases listed, it’s then key to understand where your main web properties, your social media properties, and your competitors rank against those key phrases. One of the simplest ways I have seen of presenting this, is a table that shows your best ranking against each phrase in the form of points on a grid.

On the left side, place your own web properties, both your main web properties, and any social media properties your team runs. For comparison, place your key competitors’ web properties on this side of the chart also. Along the top row, build columns for each of the following search ranks: First place, top 3, top 5, top 10, top 30, and top 100. Then, for each of the search phrases in your list, each property a point in the highest category it is discovered in.

For example, if “widget transportation” is a search phrase of interest, and your website appears as number 8 on the natural ranks on Google for that page, you would give yourself one point in the “top 10” category for your main website. Note, that if you use a marketing automation system or web analytics package to understand which search phrases are being used to find you, this will only show you the phrases where you are already successful. Be sure to include search phrases where you would ideally be found, but currently are not.

Complete this process for all the search phrases (around 100 phrases is often a useful number to gain a good perspective), and you will find an overall discoverability profile for you and your competitors. Note that the first page of search results is generally seen as the only page offering significant value in terms of traffic, so the results that are lower down than that can give indications of progress, but are unlikely to be driving traffic.

This view gives an easily digestible sense of your natural search engine discoverability. It should be noted, however that results will vary by search engine, geography, and over time. It is not a report that gives a definitive answer, but it is useful for providing a perspective as to where you are as a business and whether you are making progress in terms of being discoverable.
BOOK
Many of the topics on this blog are discussed in more detail in my book Digital Body Language
SOFTWARE
In my day job, I am with Eloqua, the marketing automation software used by the worlds best marketers
EVENTS
Come talk with me or one of my colleagues at a live event, or join in on a webinar